Exploring Scalable AI-Based Analytics Pipelines with Databricks & AWS

Apr 28, 2026
8 min read
Preface
GenVoyage - a personal travel concierge that books flights, stays, and plans entire travel itineraries- was an extremely data-heavy project. Our concept was to connect with various data sources that already knew the user and use that data to carefully curate travel packages for the user, creating highly personalized and appealing travel packages.
The practical implementation, however, was not straightforward. It was easy to find APIs for luxury hotels and resorts. Finding APIs for budget accommodations, such as hostels, proved challenging. I briefly considered using less conventional data scraping methods, like those from Apify, to look for stay options, but quickly reverted to company standards for data sourcing integrity. I was about to give up when I decided to do a final search on ChatGPT, which told me to “try the Airbnb API”. With renewed focus, when I looked into the Airbnb API, I found that while an API did exist, access was limited to a select group of approved partners.
Feeling discouraged, I presented my findings to my manager and, to my surprise, she said, “It’s possible”. All I needed to do was find official datasets and build a pipeline around that. Then, the ball would be in her court.
Introduction
While there was the possibility of our company requesting to become partners with Airbnb, my manager told me that it would take time and that I needed to start building my pipeline around mock Airbnb data. Thankfully, Airbnb periodically releases official datasets, so I was able to start my journey.
As a junior data engineer, I was highly motivated to explore cutting-edge technologies like AWS Glue, Amazon Kinesis Data Streams, Apache Spark, Apache Kafka, and Temporal for this project. I went to our lead engineer, who said:
“Abdullah, it’s awesome that you want to try everything out and learn. However, when building a product, you don’t create problems by forcefully using everything. You look at the problem and try to find the easiest and most cost-effective solution.”
While this feedback was initially disappointing, it led to the introduction of the Databricks platform. Our entire application was hosted on Amazon Web Services (AWS). However, Databricks is not an AWS-native product or service. We were happy with AWS, and we neither wanted to migrate nor take on the added complexity of a multi-cloud environment.
This is where AWS demonstrates its strengths; as the largest cloud provider in the world, not only do most SaaS platforms provide integrations with it, but they also provide tenancy options. After digging deeper into Databricks, I found out that we could use Databricks without ever leaving the AWS environment.
As we dive deeper into this use case, I can’t share the specifics of the original project. However, to demonstrate the pipeline’s capabilities, I’ll use the same dataset and platform with a different set of Key Performance Indicators (KPIs), showing how Databricks on AWS can be used for AI-driven analysis of Airbnb listings and hosts.
The Problem
As an AWS Data Engineer tasked with designing and integrating a pipeline to match users with Airbnb listings most suitable for them, I went through some samples of data and started trying to figure out what metrics we could use to support our use case.
Constraints
User-facing products require loads of pre-planning to ensure resilience and durability. Our use case required:
Daily updated metrics to keep available listings fresh
Maintainable and serverless pipeline for quick changes, cost efficiency, and scalability
Visualization dashboards for each KPI for observability and visibility for internal stakeholders
KPIs
With thorough consideration of the data available to us and stakeholder requirements, I came up with the following set of metrics:
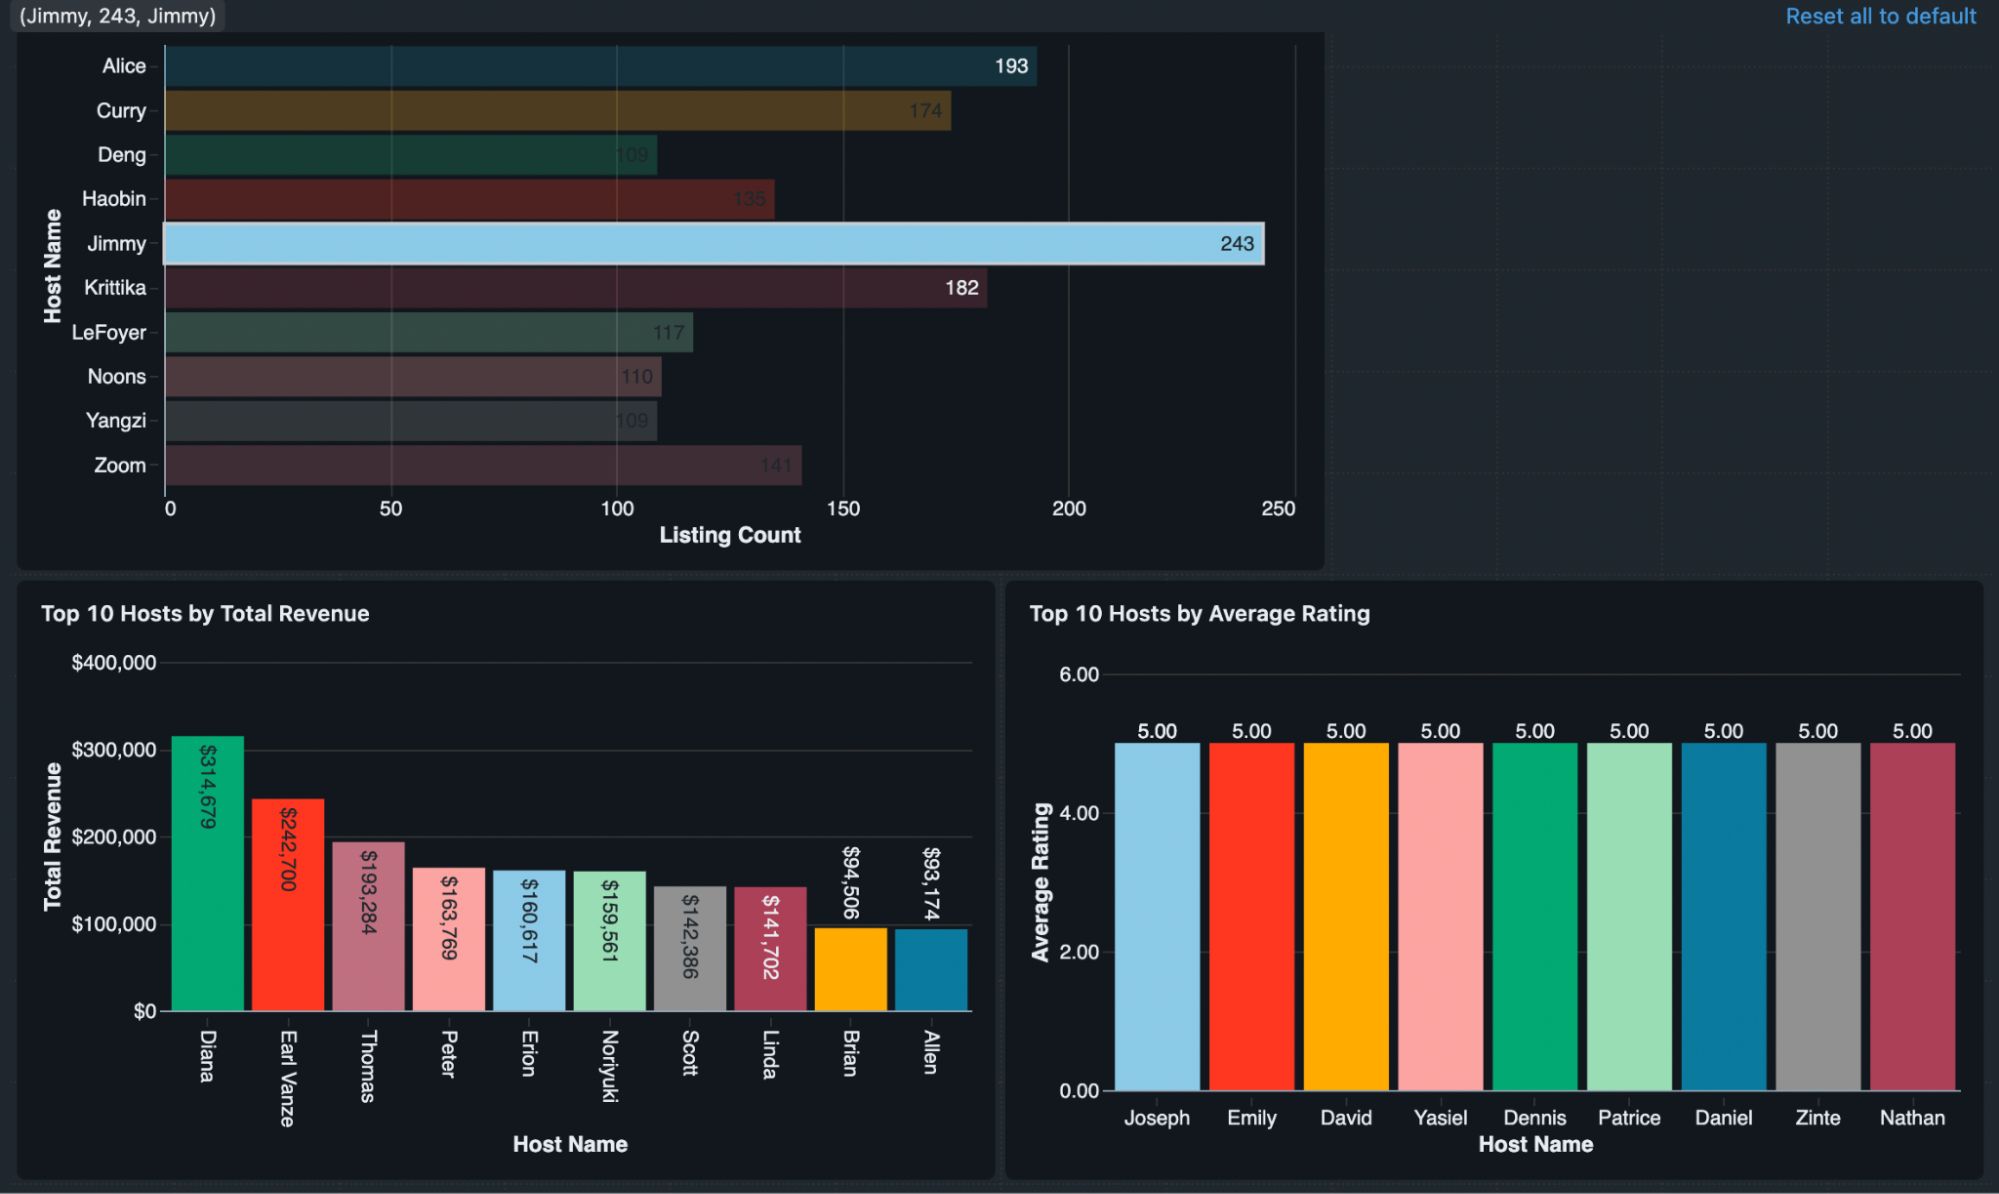
Top Hosts by Listing Count, Top Hosts by Revenue, and Hosts by Average Rating: To be able to maintain internal rankings for providers
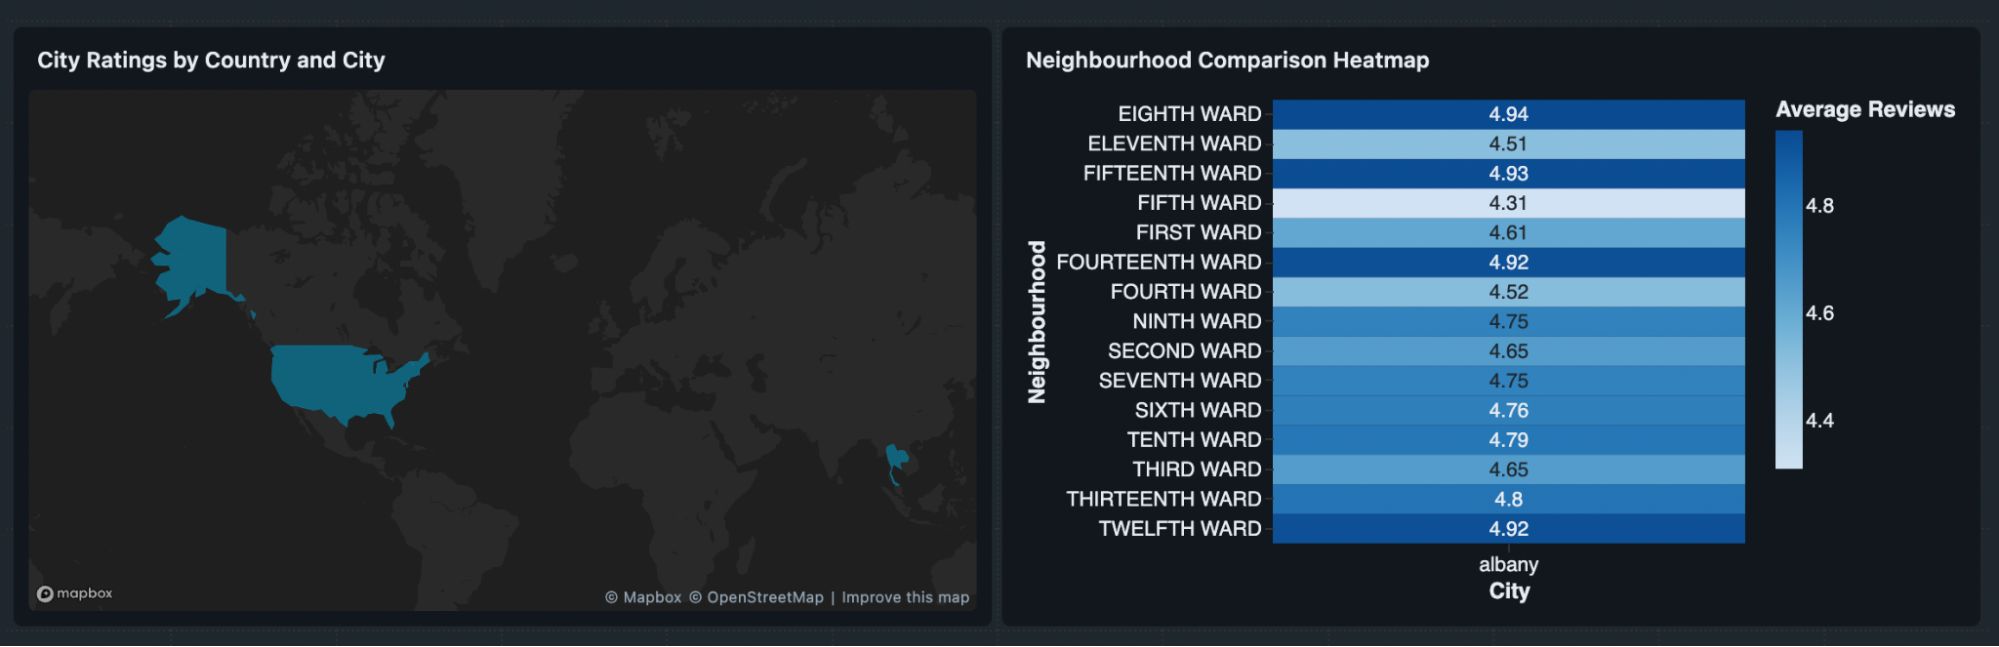
Average Rating per City and Neighbourhood Performance: To build out entire itineraries based on destination experience
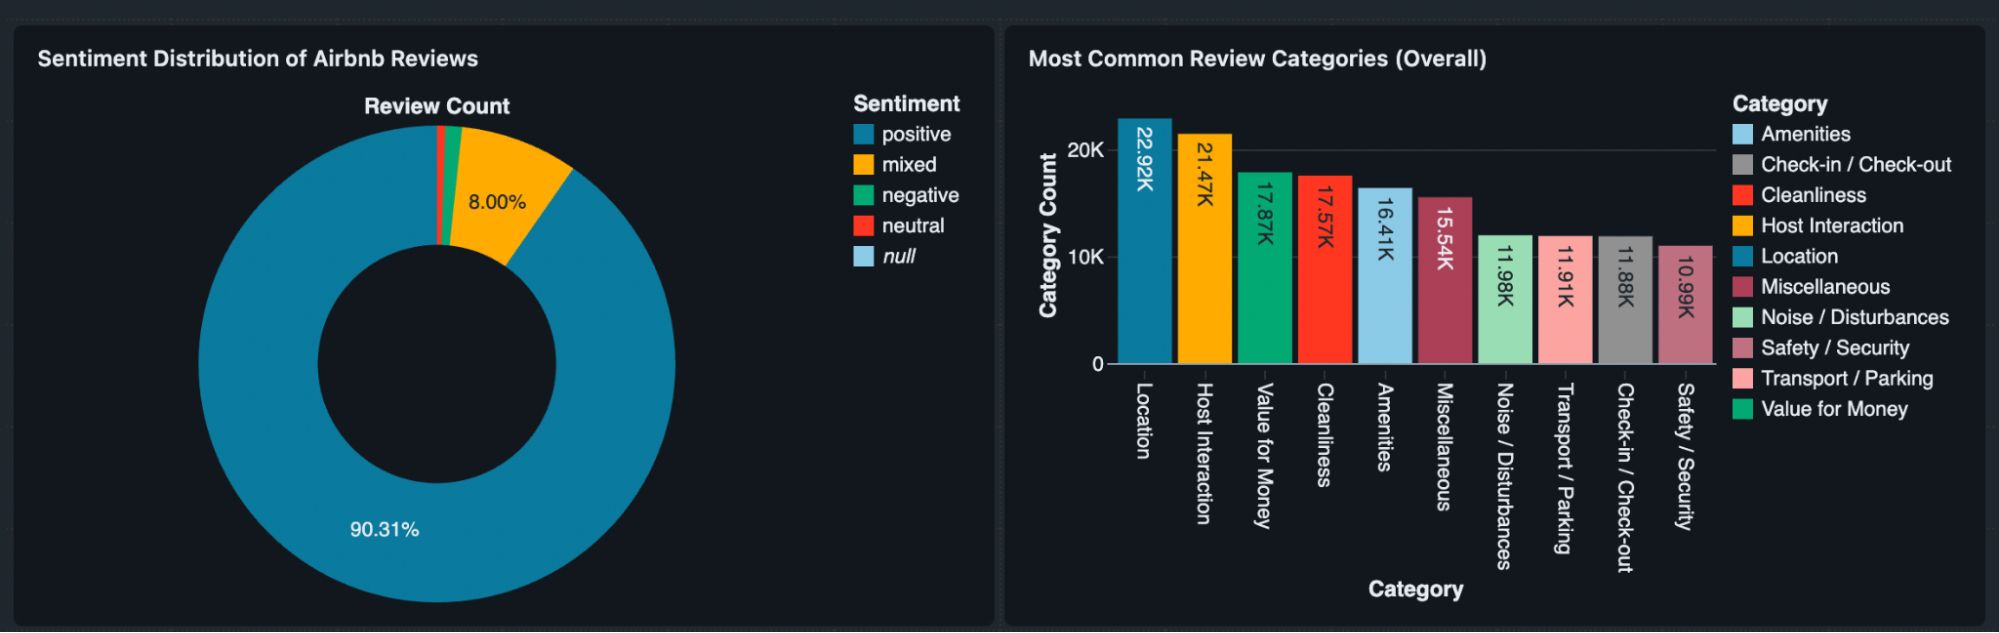
Sentiment Distribution, Most Common Review Categories, and Top 5 Categories per Listing: For fine-grained matches between users and stays, based on personal preferences and behavioral patterns
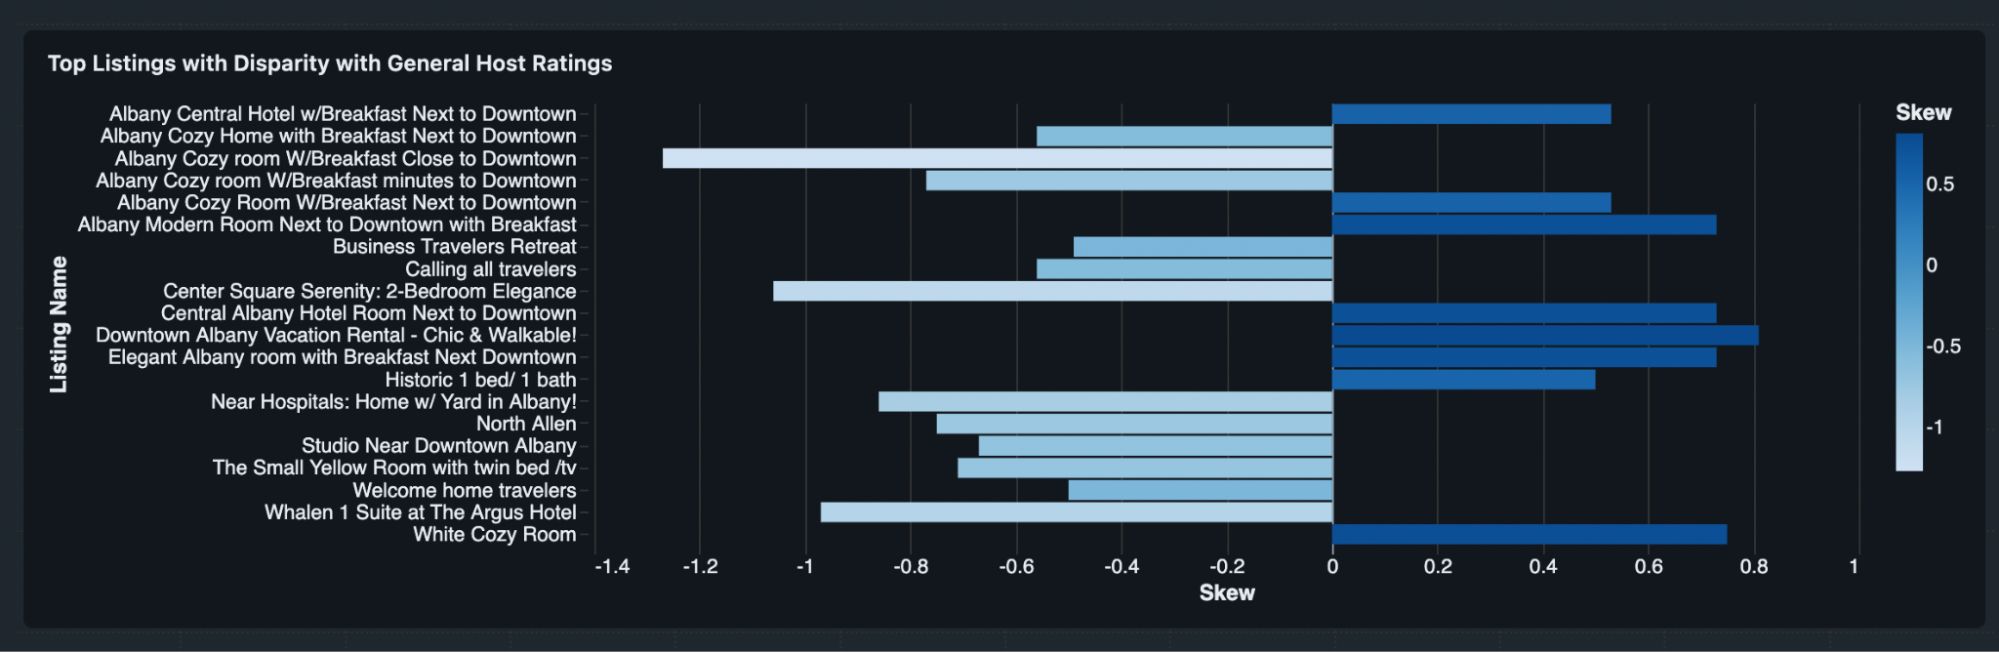
Revenue vs Rating Correlation, Number of Reviews vs Average Rating, and Host Average Ratings Compared to Ratings of Individual Listings (Skew): For the final validation of listings based on aggregated ratings at a large scale
The Approach
Given the constraints, I thought it would be best to opt for a Data Lake architecture, which provides the flexibility of a data warehouse without the cost. Here, I had two options: Amazon S3 Table Buckets (built on top of the open Apache Iceberg format) or Databricks Delta Tables (built on top of the open Delta Lake format). Since my lead had already suggested using Databricks for the project, I went ahead with the latter.
The pipeline needed to be maintainable as well, which meant easier adaptation to schema evolution, upstream data changes, and being able to adapt to the ever-evolving needs of downstream stakeholders. That’s when I came across the concept of building pipelines on top of the medallion architecture.
Medallion Architecture
The medallion architecture divides your data and your pipeline into 3 stages for maintainability and clear segregation of different types of data.
Bronze Layer
This layer is the first layer in the pipeline and contains raw/near raw data. Consider this as the staging area, where data sources dump data that needs to be processed by the pipeline.
Airbnb provides 3 files for any dataset:
listings.csv
neighbourhoods.csv
reviews.csv
We already had an ingestion pipeline setup for these datasets to be put into an S3 bucket. All we did here was connect our AWS account with our Databricks account and provide it with access to our S3 bucket.
from pyspark.sql import functions as F
import dlt  # Ensure dlt is imported for Lakeflow Declarative Pipelines
@dlt.table

def airbnb_listings_bronze():
    listings = (
        spark.readStream
        .format('cloudFiles')
        .option('cloudFiles.format', 'csv')  # Correct option name
        .option('header', 'true')
        .option('inferSchema', 'true')
        .option("quote", '"')  # <- handles fields with commas
        .option("escape", '"')  # <- handles quotes inside the field
        .option("multiline", "true")
        .option('schemaLocation', 's3://abdullah-de-airbnb-catalog/schema/listings_raw/')
        .option('cloudFiles.includeExistingFiles', 'true')
        .load('s3://abdullah-de-airbnb-raw/*/*/*/*/*/listings.csv')
    ).withColumn('metadata', F.col('_metadata'))

    return listings
This part of the pipeline converts CSV records to Parquet records and saves them to the “bronze” part of our data lake, along with source metadata (which contains partition information such as city, country, and date).
Silver Layer
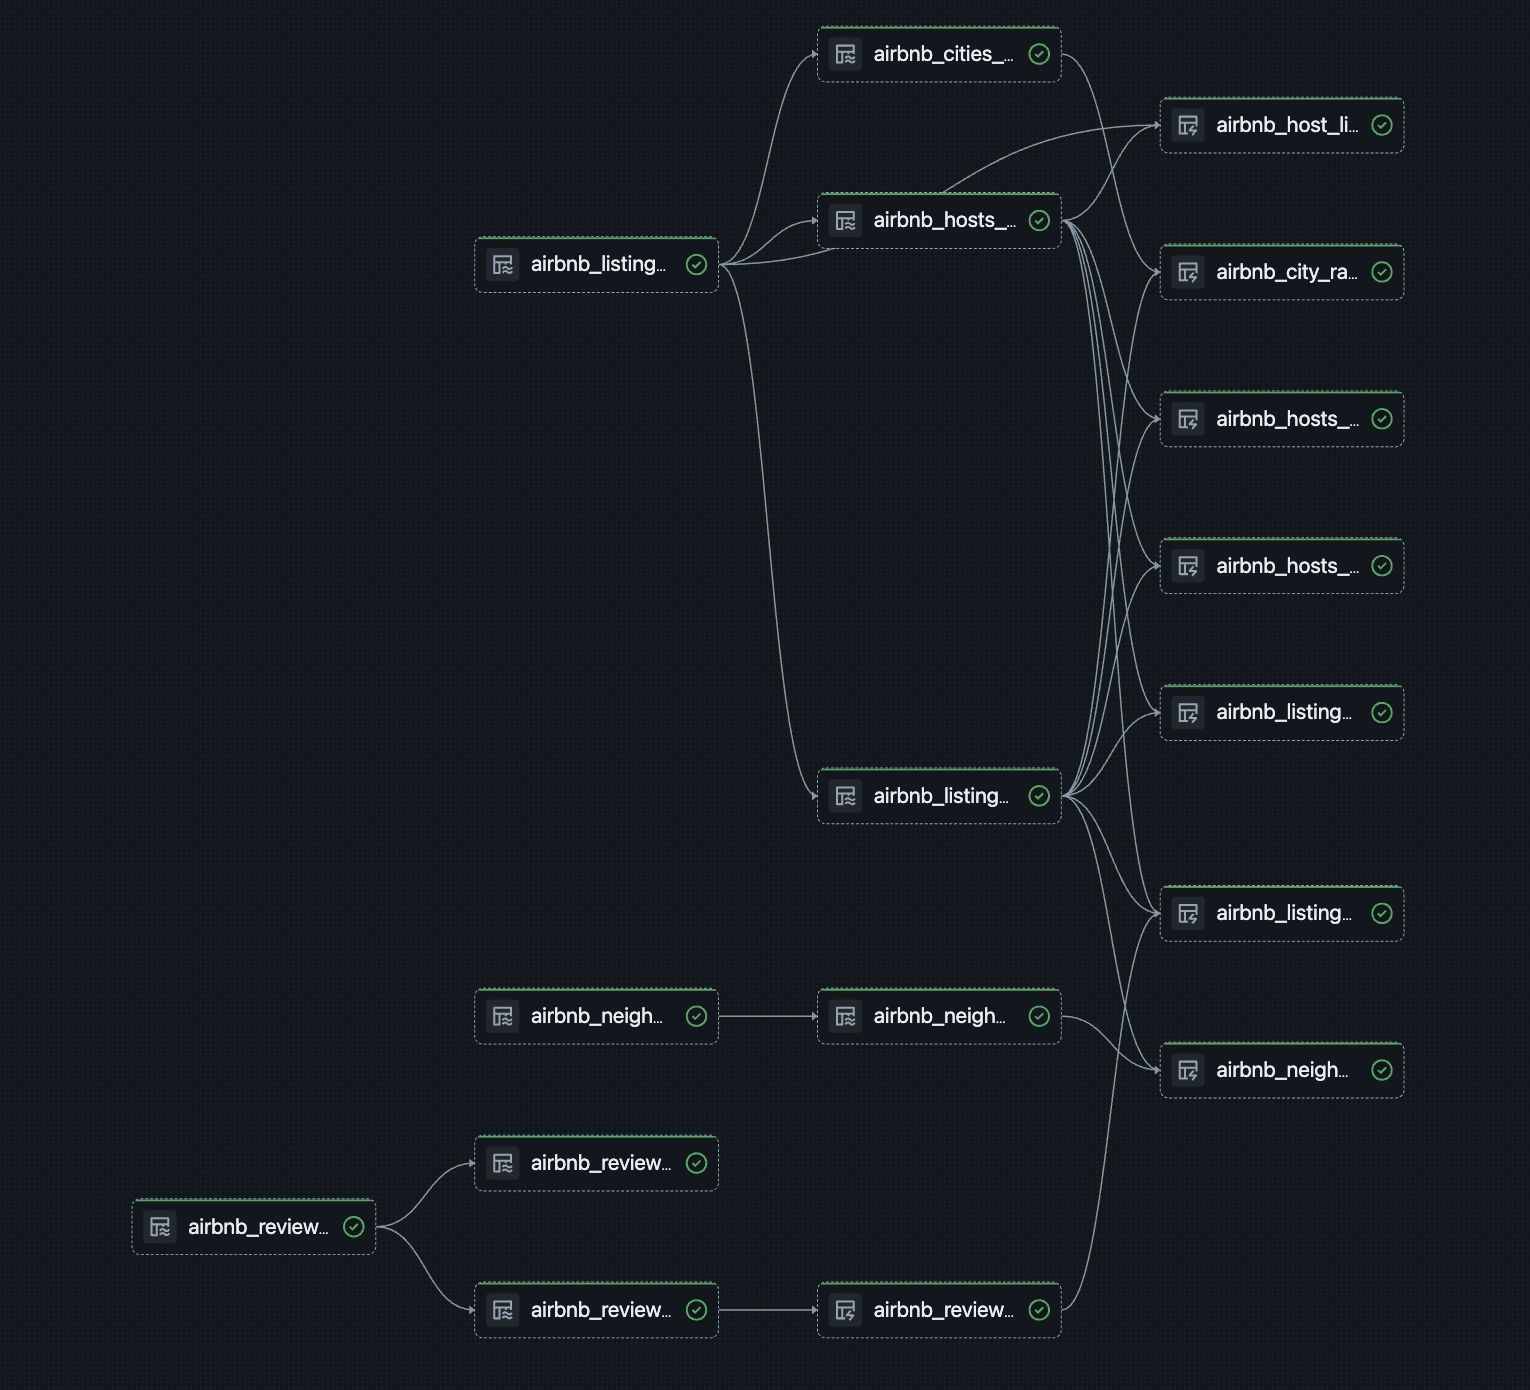
This layer contains clean data, which can be easily used for aggregation. With our bronze layer set up with the following tables:
airbnb_listings_bronze
airbnb_reviews_bronze
airbnb_neighbourhoods_bronze
There was still a lot of redundant data that needed to be deduped and structured properly. So, we decided to extract and separate host data and geodata into separate tables, i.e.:
airbnb_cities_silver
airbnb_hosts_silver
airbnb_listings_silver
airbnb_neighbourhoods_silver
airbnb_reviews_silver
import pyspark.sql.functions as F
import dlt
@dlt.table(name="airbnb_hosts_silver")

def airbnb_hosts_silver():
    return (
        dlt.read_stream("airbnb_listings_bronze")
        .select(
            F.col("host_id").alias("id"),
            "host_url",
            "host_name",
            F.to_date("host_since").alias("host_since"),
            "host_location",
            F.trim("host_about").alias("host_about"),
            "host_response_time",
            F.when(F.col("host_response_rate") == "N/A", None)
             .otherwise(F.regexp_replace("host_response_rate", "%", "").cast("int"))
             .alias("host_response_rate"),
            F.when(F.col("host_acceptance_rate") == "N/A", None)
             .otherwise(F.regexp_replace("host_acceptance_rate", "%", "").cast("int"))
             .alias("host_acceptance_rate"),
            (F.col("host_is_superhost") == "t").alias("host_is_superhost"),
            "host_thumbnail_url",
            "host_picture_url",
            "host_neighbourhood",
            F.coalesce(
                "host_total_listings_count",
                "calculated_host_listings_count"
            ).alias("host_total_listings_count"),
            F.transform(
                F.split(
                    F.regexp_replace("host_verifications", r"[\[\]']", ""),  # note raw string `r""`
                    ","
                ),
                lambda x: F.trim(x)
            ).alias("host_verifications"),
            (F.col("host_has_profile_pic") == "t").alias("host_has_profile_pic"),
            (F.col("host_identity_verified") == "t").alias("host_identity_verified"),
        )
        .dropDuplicates(["id"])
    )
This was a comparatively lengthier process as it involved:
Deduplication
Data cleaning
Normalizing
Combining with the partition (source) data
Gold Layer
This is the final layer, where the aggregated (golden) data lives. The data that either represents the KPIs or is the KPIs.
Here, we created tables representing/to be used for each KPI:
airbnb_host_listings_counts_gold
airbnb_city_ratings_gold
airbnb_hosts_revenue_gold
airbnb_hosts_reviews_gold
airbnb_listing_skew_gold
airbnb_listing_top_categories_gold
airbnb_neighbourhood_ratings_gold
This is where the table names actually start making sense for data analysts and stakeholders.
Also, here’s where the awesome AI stuff happens. Databricks provides built-in functions for using AI for classification, labelling, or just direct inference from an LLM of your choice. I used it for sentiment analysis and to categorize reviews.
# ------------------------------
# AI sentiment and categories
# ------------------------------
@dlt.table(
    name="airbnb_reviews_gold",
    comment="Batch reviews with AI sentiment and extracted categories"
)
def airbnb_reviews_gold():
    reviews = dlt.read("airbnb_reviews_silver")

    return (
        reviews.select(
            F.col("id"),
            F.col("listing_id"),
            F.col("date"),
            F.col("reviewer_id"),
            F.col("reviewer_name"),
            F.expr("ai_analyze_sentiment(comments)").alias("sentiment"),
            F.expr("""
                TRANSFORM(
                    SPLIT(
                        ai_gen(
                            CONCAT(
                                "I have the following fixed set of classifiers for Airbnb reviews:\n\n",
                                "Cleanliness, Location, Host Interaction, Amenities, Value for Money, Check-in / Check-out, Noise / Disturbances, Safety / Security, Maintenance, Food / Breakfast, Transport / Parking, Miscellaneous\n\n",
                                "Please output **only** these classifiers as a **comma-separated list**, without any extra text, quotes, or explanation.\n\n",
                                "Review:\n",
                                comments
                            )
                        ),
                        ","
                    ),
                    x -> TRIM(x)
                )
            """).alias("review_categories")
        )
    )
Final Pipeline
Since Databricks allows you to build pipelines using Apache Spark/SQL, there’s a very small learning curve. Furthermore, the ability to spin up serverless notebooks for data exploration within the pipeline is a significant benefit. I used SQL for data exploration at each step, and then Apache Spark for the final pipeline, and it was an awesome experience. The best part is that you get to see your pipeline at every stage.
As for the requirement of fresh daily data, Databricks allows you to schedule pipelines according to your needs. I used a cron expression (4 0 5 * * ?) to automatically run my pipeline every day at 5 AM.Visualizations
When all was said and done, I had to get this data delivered to the key stakeholders, in a language that they understood - visualizations. Databricks supports building production-grade visualizations directly linked to the processed data. This functionality includes the option to generate visualizations with the help of their AI agent.
I divided my visualizations into multiple dashboards for ease of use and separation of concerns, and here’s what it looked like.
Host Dashboard
Geographical Dashboard
Business Dashboard
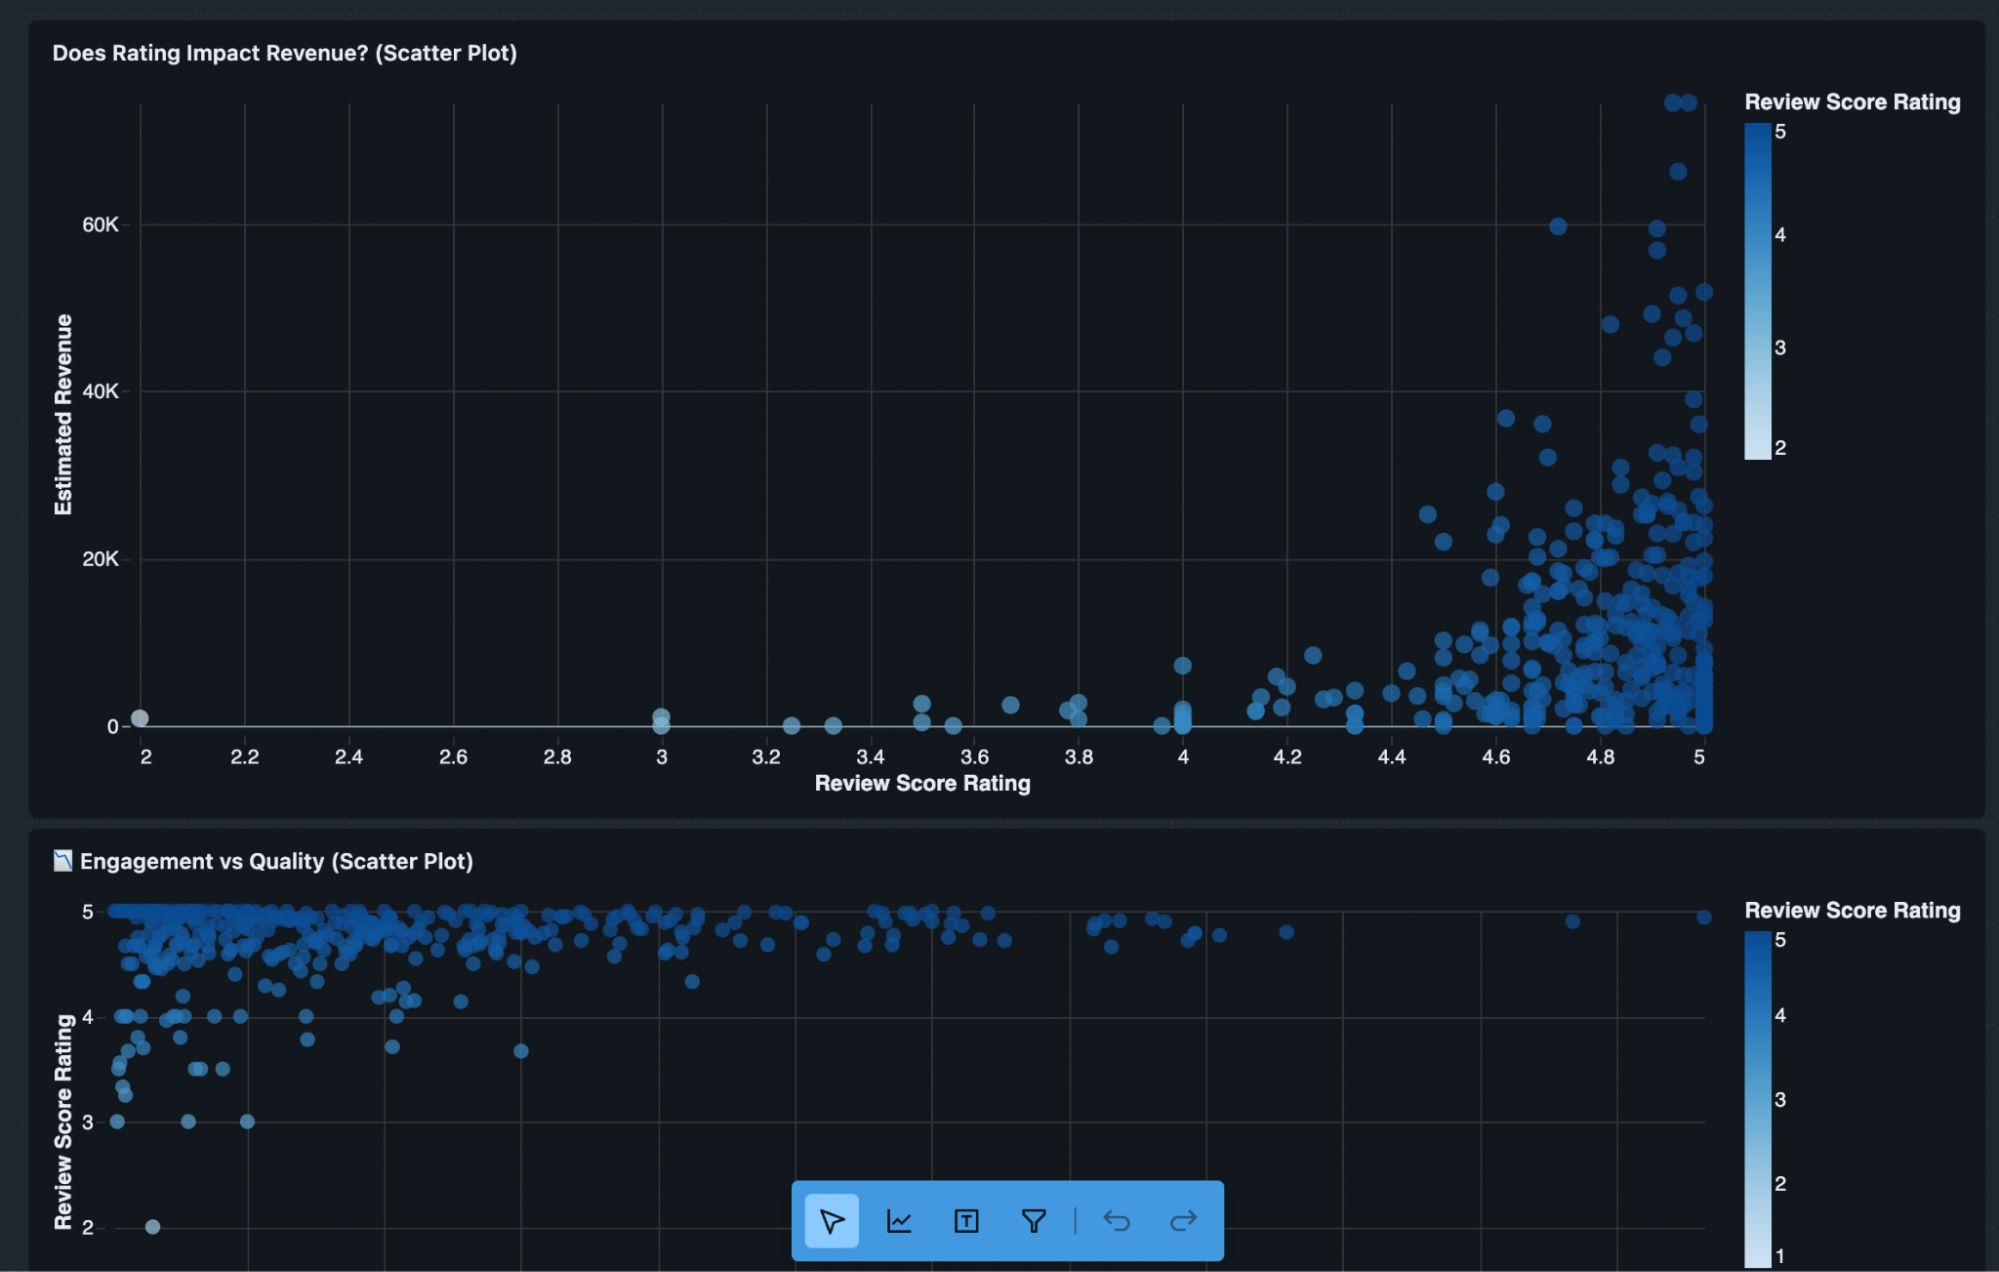
Performance Insights Dashboard
Sentiment Analysis Dashboard
Conclusion
….And here’s how you build a complete AI-based analytics pipeline with Databricks, all while staying within the AWS cloud. Technological advancements have been significant, underscoring the importance of selecting platforms that offer optimal user experience and value. However, with production-grade projects, it’s difficult to maintain that diverse array of technologies and SaaS products, due to data governance and residency concerns.

For building data pipelines and performing end-to-end analysis on them, Databricks solves that problem by giving us the option to use either of the 3 major cloud providers, which means all your data can live inside your AWS environment, every step of the way.
Appendix
Repository Link: https://github.com/abdullahirfann/airbnb-analysis-pipeline-databricks