
JMeter Variables Usage for the Test Plan

Jun 13, 2025
3 min read
If you’re working in QA or performance testing, you’ve probably used Apache JMeter at some point. Whether you’re stress testing a local web app or benchmarking an API, JMeter is a go-to tool.
Most people use it just for basic load testing. However, its advanced features are best utilized for end-to-end load testing.
So here’s a full list of JMeter tricks and techniques I’ve used while working on load testing projects.
One of the most common mistakes: hardcoding URLs, tokens, and credentials in every request.
Instead, use the User Defined Variables config element, or load external .properties files. That way, you can switch between environments like this:jmeter -n -t testplan.jmx -p dev.properties
Inside your requests, just call${base_url}or${auth_token}— and you’re good to go.
Use the User Defined Variables option to define variables in JMeter:
JMeter Variables Usage for the Test Plan
JMeter allows you to read from a CSV file to simulate multiple users. It is great for testing logins, form submissions, and different workflows.
Just create a CSV like:
username,password
user1,pass123
user2,pass456
Add CSV config element in JMeter and use${username}and${password}in your requests. One thread means one unique user from csv file; this ensures no duplicate issues.
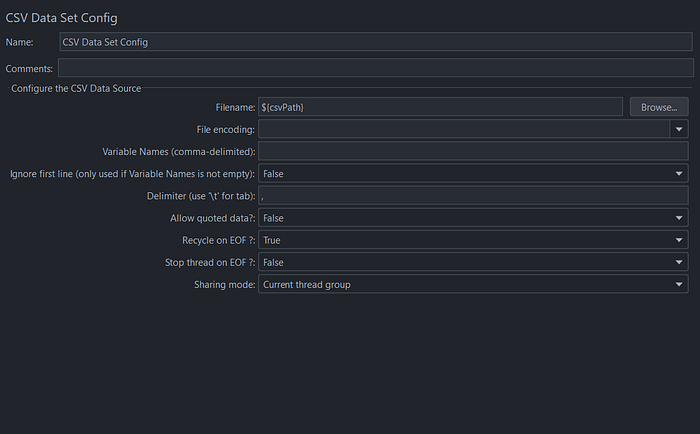
CSV config in JMEter
You can dynamically create test values with built-in functions:
${__UUID()} for a unique ID${__Random(1000,9999)} for random values${__time()} for timestampsFor example, while creating users, use random emails with the following function:
user_${__Random(1000,9999)}@example.com
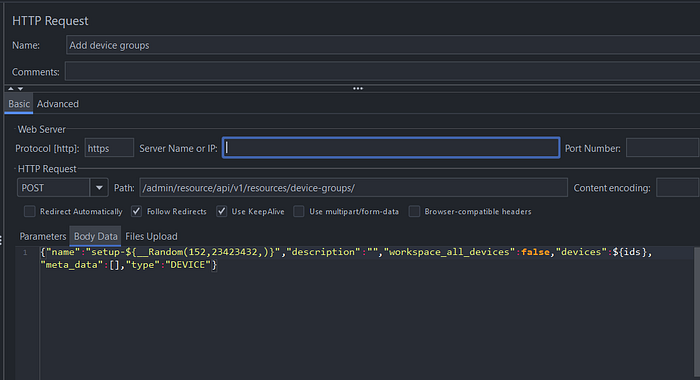
Using random function to generate random name of device group
Instead of cluttering your main flow, use:
• Set up the Thread Group for pre-test steps: login, token generation, and creating test data.
• Teardown Thread Group for post-test cleanup: deleting test data, logging out, etc.
This keeps your script clean and CI/CD-friendly.
If your thread group has multiple iterations but login or setup needs to happen only once per thread, use the Once Only Controller.
Very useful for workflows like:
Login (only once)
Fetch data
Submit the form (multiple times)
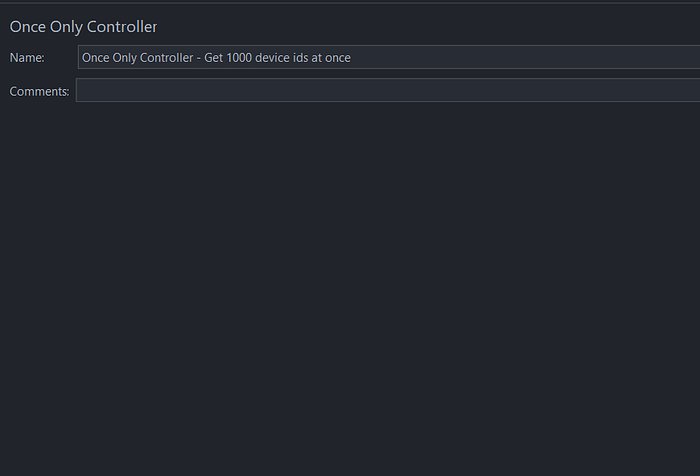
Using Once Only Controller to get device ids at once.
For this purpose, use Post-Processors like:
JSON Extractor
Regular Expression Extractor
XPath Extractor
Example: After login, extract the token:
{
  "token": "abc123"
}
Set up a JSON Extractor:
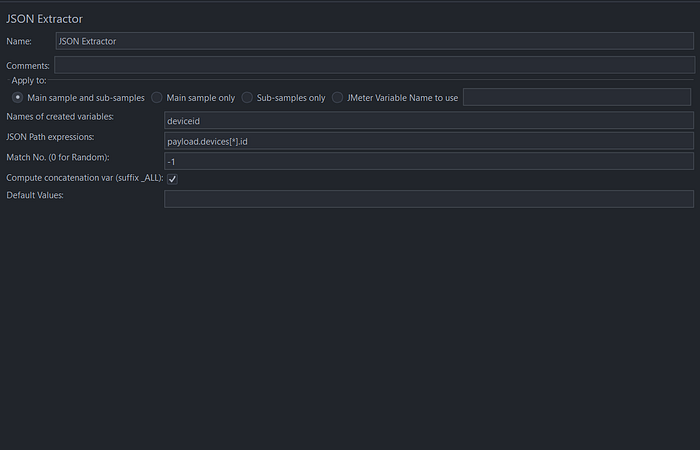
Extract device ids in an array from the response
Then use ${deviceid} in the next request.Never assume that all responses are OK. Use Response Assertions to check:
Text presence ("success","200 OK")
JSON field values ($.status == "done")Status codes
It’ll help you catch subtle failures like 500 errors or failed logins.During heavy tests, GUI listeners like View Results Tree will crash JMeter. They can consume extra memory and cause the system to overload.
Use memory-friendly listeners:
Summary Report for basic stats
Backend Listener to push metrics to InfluxDB + Grafana
Simple Data Writer to save .jtl logs for later analysisGUI is just for debugging. For CLI-based tests, it is best to use a clean HTML report. In short, Real tests = headless mode + clean reports.
Real users don’t click like robots. Add Timers:
Constant Timer
Uniform Random Timer
Gaussian Timer
This simulates realistic user behavior and spreads your load nicely over time.
JMeter’s newer versions automatically generate detailed HTML reports.
Run this command:
jmeter -n -t testplan.jmx -l results.jtl -e -o /path/to/report
It’ll generate:
Active Threads over Time
Response Time Distribution
Errors per Second
Throughput vs. Response Time
Perfect for sharing with devs or clients.
JMeter is a powerful weapon in any QA engineer’s toolkit — but only if you use it correctly. From concurrency tuning and pre/post logic to dynamic test data and HTML reporting, there’s a lot you can do beyond just “run test and check response time.”
As QA engineers, we should go beyond the basics and really explore these tools. You’ll be surprised how much value you can bring to your team once you start using JMeter smartly.
Happy load testing! 🚀